
HTML Viewer in Chrome
Chrome can view HTML in several ways. The right method depends on whether you have a local file, an existing website, source code that needs editing, or a page that must be shared.
Four Chrome Workflows
| Method | What it shows | Best for |
|---|---|---|
| Open a local file | The rendered local document | A quick private check |
view-source: | Original response source | Reading the source of an existing URL |
| Chrome DevTools | Live DOM, CSS, console, and network | Debugging a page already open |
| Online HTML viewer | Editable source and a rendered preview | Reviewing and sharing one document |
An online viewer still uses browser rendering, but wraps it in a workflow for adding source, checking common viewport widths, and publishing a reviewed link.
Open a Local HTML File in Chrome
On desktop, drag the .html file into a Chrome window or use Open File from the browser menu. The address begins with file://.
That preview is local. Someone else cannot open the same path because the file is not hosted. Relative images and stylesheets work only when the supporting files remain in the expected folders.
Use View Source
Add view-source: before an existing page URL:
view-source:https://example.comView Source shows the original HTML response. It does not provide your own editable document or show the live DOM after scripts have changed it. Read what an HTML viewer is for the full distinction.
Use Chrome DevTools
Open DevTools when you need computed styles, console errors, network requests, event listeners, or the current DOM. Changes in the Elements panel are temporary and normally disappear when the page reloads.
DevTools is the strongest option for debugging an existing website. An HTML viewer is the shorter option when the starting point is your own source or file.
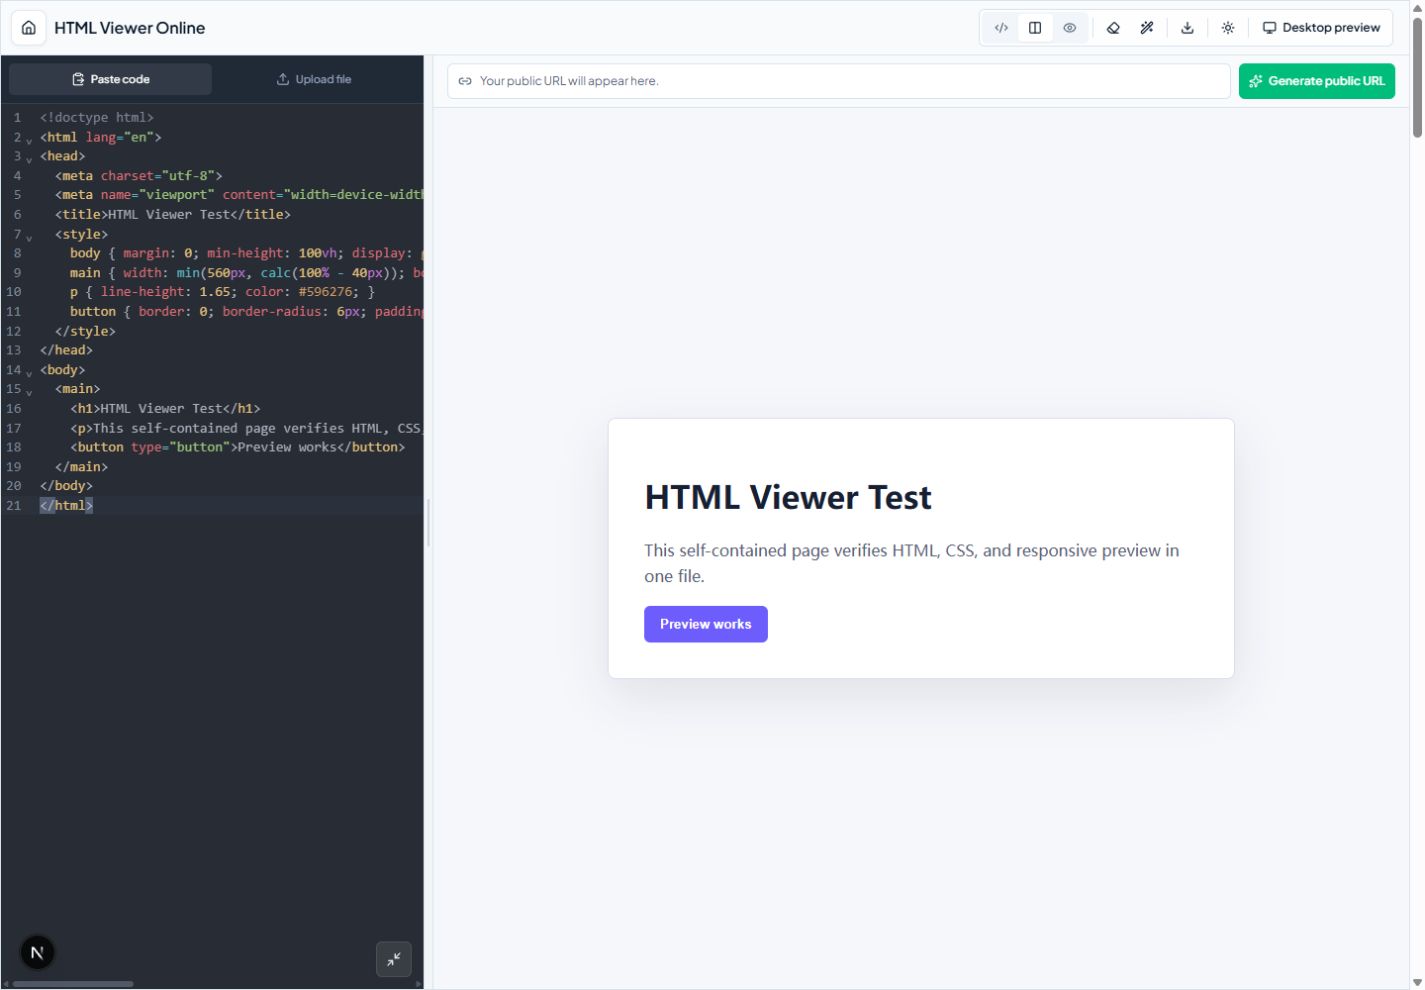
Use an Online Viewer for Editing and Sharing
Paste the document or upload the file to HTML Viewer Online. Render it, make focused corrections, test another viewport, and publish a URL after review.
If the goal is specifically to turn source into a link, follow the guide on converting HTML to a URL.
Choose the Chrome Workflow by Question
Each Chrome workflow answers a different question. Opening a local file asks, "What does this saved document render like on this computer?" View Source asks, "What HTML did the server originally return?" DevTools asks, "What document, styles, requests, and runtime state exist now?" An online viewer asks, "Can I inspect, edit, and possibly share this focused document without setting up a project?"
Choosing the wrong mode creates misleading conclusions. View Source will not show elements inserted later by JavaScript. DevTools edits are temporary and disappear after a reload. A local file may lack neighboring assets. An online preview may use a sandbox or different origin. State the question first, then select the surface that exposes the evidence you need.
For a normal review, begin with rendered output, move to DevTools for a visible defect, and use View Source only when the original response matters. Use an editable viewer when you need to revise a standalone document or hand it to another reviewer.
What Happens with a Local File
Chrome can render many .html and .htm files directly. The address begins with file://, indicating that the page came from local storage rather than a web server. This is appropriate for self-contained documents, exported reports, saved examples, and basic exercises.
The local context has limits. Relative images and style sheets work only when the referenced folders are still in the expected positions. Absolute paths from someone else's computer do not work on yours. Module imports, cross-origin requests, service workers, and server-generated routes may behave differently or fail completely.
Do not change broad browser security flags to make a questionable file work. If the document needs server behavior, run it through the project's approved local development server. If it needs only one missing asset, correct or package the reference. Keeping the environment honest produces a result that another person can reproduce.
Open Files and Folders Carefully
Use the operating system's Open with action, drag a known file into Chrome, or use a supported file-open dialog. Confirm the filename in the tab and compare its modified time with the version you intended to test. Duplicate downloads commonly add a number to the filename, making it easy to review an older copy.
If the document arrived as a ZIP archive, extract the entire archive before opening the main HTML file. Keep folders in place. A saved website may include a companion directory whose name resembles the page name; moving only the HTML breaks images and styles.
A browser tab rendering a local file is not a hosted URL. Sending its file:// address gives another person a path that refers to your machine, not the document. For collaboration, send an approved file bundle or publish a sanitized example through a suitable service.
Use View Source for the Original Response
View Source displays the serialized source associated with a page load, usually the HTML the server returned before client-side code changed the document. It is useful for checking metadata, canonical links, structured data in the response, script tags, stylesheet references, and whether important content exists without JavaScript.
Search within the source for a distinctive heading or metadata field. If content appears in the rendered page but not in View Source, JavaScript may have created it or fetched it later. That does not automatically make the page wrong, but it changes how crawlers, disabled scripts, and initial loading behave.
Source formatting may be minified or generated, and it may differ from the application's original templates. Do not treat it as the project's maintainable source code. For that, use the repository. View Source is evidence about one delivered response.
Inspect Runtime Behavior with DevTools
The Elements panel shows the current DOM after browser parsing and script changes. Select a visible element to inspect matched CSS, computed values, box dimensions, accessibility information, and event listeners. Toggle one declaration to test a hypothesis, but remember that the edit is temporary.
Use Console for script errors and controlled experiments. Start with the earliest error because later failures may be consequences. Use Network to find missing images, blocked scripts, slow requests, redirects, and response headers. Reload with the panel open so requests from the beginning are captured.
The Sources panel helps locate loaded scripts and set breakpoints. The Application panel exposes storage and service-worker state. These tools are more appropriate than a simple viewer when the bug depends on authentication, caching, API timing, or code that changes the page after load.
Treat DevTools Edits as Experiments
Changing text or CSS in Elements is useful for proving a solution. It does not save the edit back to the original file by default. Copy the confirmed change into the actual source, reload, and verify that the behavior persists. Otherwise a convincing browser experiment can disappear with no record.
Keep experiments small. Toggle one rule, add one class, or change one value. If the result improves, identify the responsible source file and implement it there. Large unrecorded edits are hard to reproduce and may hide interactions with the project's cascade.
Chrome offers local override and workspace features for advanced workflows, but they require deliberate setup and can change what the browser serves. Label that state clearly. For occasional editing of one document, a viewer with an explicit source panel is easier to understand.
Test Mobile Layout in Chrome
Device emulation changes the viewport and can simulate some input and network characteristics. It is useful for finding responsive breakpoints, overflow, controls that are too close together, and content hidden by fixed headers. Test a narrow width, an intermediate width, and a wide width rather than relying on one named device preset.
Emulation is not a complete physical-device test. Mobile browser interface bars, keyboards, font rendering, memory limits, touch behavior, and operating-system integrations can differ. Use emulation for fast iteration, then confirm important flows on at least one real target device.
When a layout fails, inspect the element causing horizontal overflow. Fixed pixel widths, long unbroken text, wide tables, and absolutely positioned controls are common causes. Correct the owning component instead of hiding all overflow at the page level.
Know When an Online Viewer Helps
An online viewer adds value when the source is a single document and another person needs to inspect the same result. It can combine upload or paste, source editing, preview widths, and a browser-ready handoff. That is more focused than sending DevTools screenshots without the underlying example.
Sanitize the document before upload. Remove tokens, private URLs, customer data, hidden form values, and comments that should not leave the organization. Check every remote script and image because opening the shared result may contact those domains.
An online viewer is not required for every Chrome task. Keep a confidential file local. Use DevTools for runtime diagnosis. Use the real project and development server for modules, routes, and backend behavior. The online path is strongest for a small, reviewable artifact.
Chrome Troubleshooting Sequence
If Chrome displays source as text, confirm the extension and the response content type. If it downloads repeatedly, inspect whether the server marks it as an attachment. If the page is blank, disable or isolate scripts and inspect the first console error. If styling is missing, check the stylesheet request and relative path.
For stale content, verify the exact file first, then reload with cache disabled only while DevTools is open. Persistent application state may also come from a service worker or storage. Clear only the relevant data so you do not erase unrelated browser sessions.
Finish by repeating the task from a clean tab. Record the Chrome version, operating system, URL or file type, viewport, and exact steps. This turns an observation into a reproducible browser report and clarifies whether the fix belongs in HTML, assets, server configuration, or the viewing workflow.
Frequently Asked Questions
Does Chrome have a built-in HTML viewer?
Yes. Chrome renders local HTML files and websites. View Source and DevTools add source inspection, while an online viewer adds an upload, edit, preview, and sharing workflow.
Why can nobody else open my file URL?
A file URL points to a path on your own device. Host or publish the document to create an HTTPS address another browser can reach.
Do I need a Chrome extension to view HTML?
No. Chrome can render HTML directly, and a browser-based viewer can add editing and sharing without installing an extension.